
Novel Algorithms for Adaptive Optics
Origin Publication
Repeatability of Adaptive Optics Automated Cone Measurements in Subjects With Retinitis Pigmentosa and Novel Metrics for Assessment of Image Quality
Translational Vision Science & Technology
2019 May; 8(3): 17
Authors: Michael Gale, Gareth Harman, Jimmy Chen, Mark Pennesi
Background
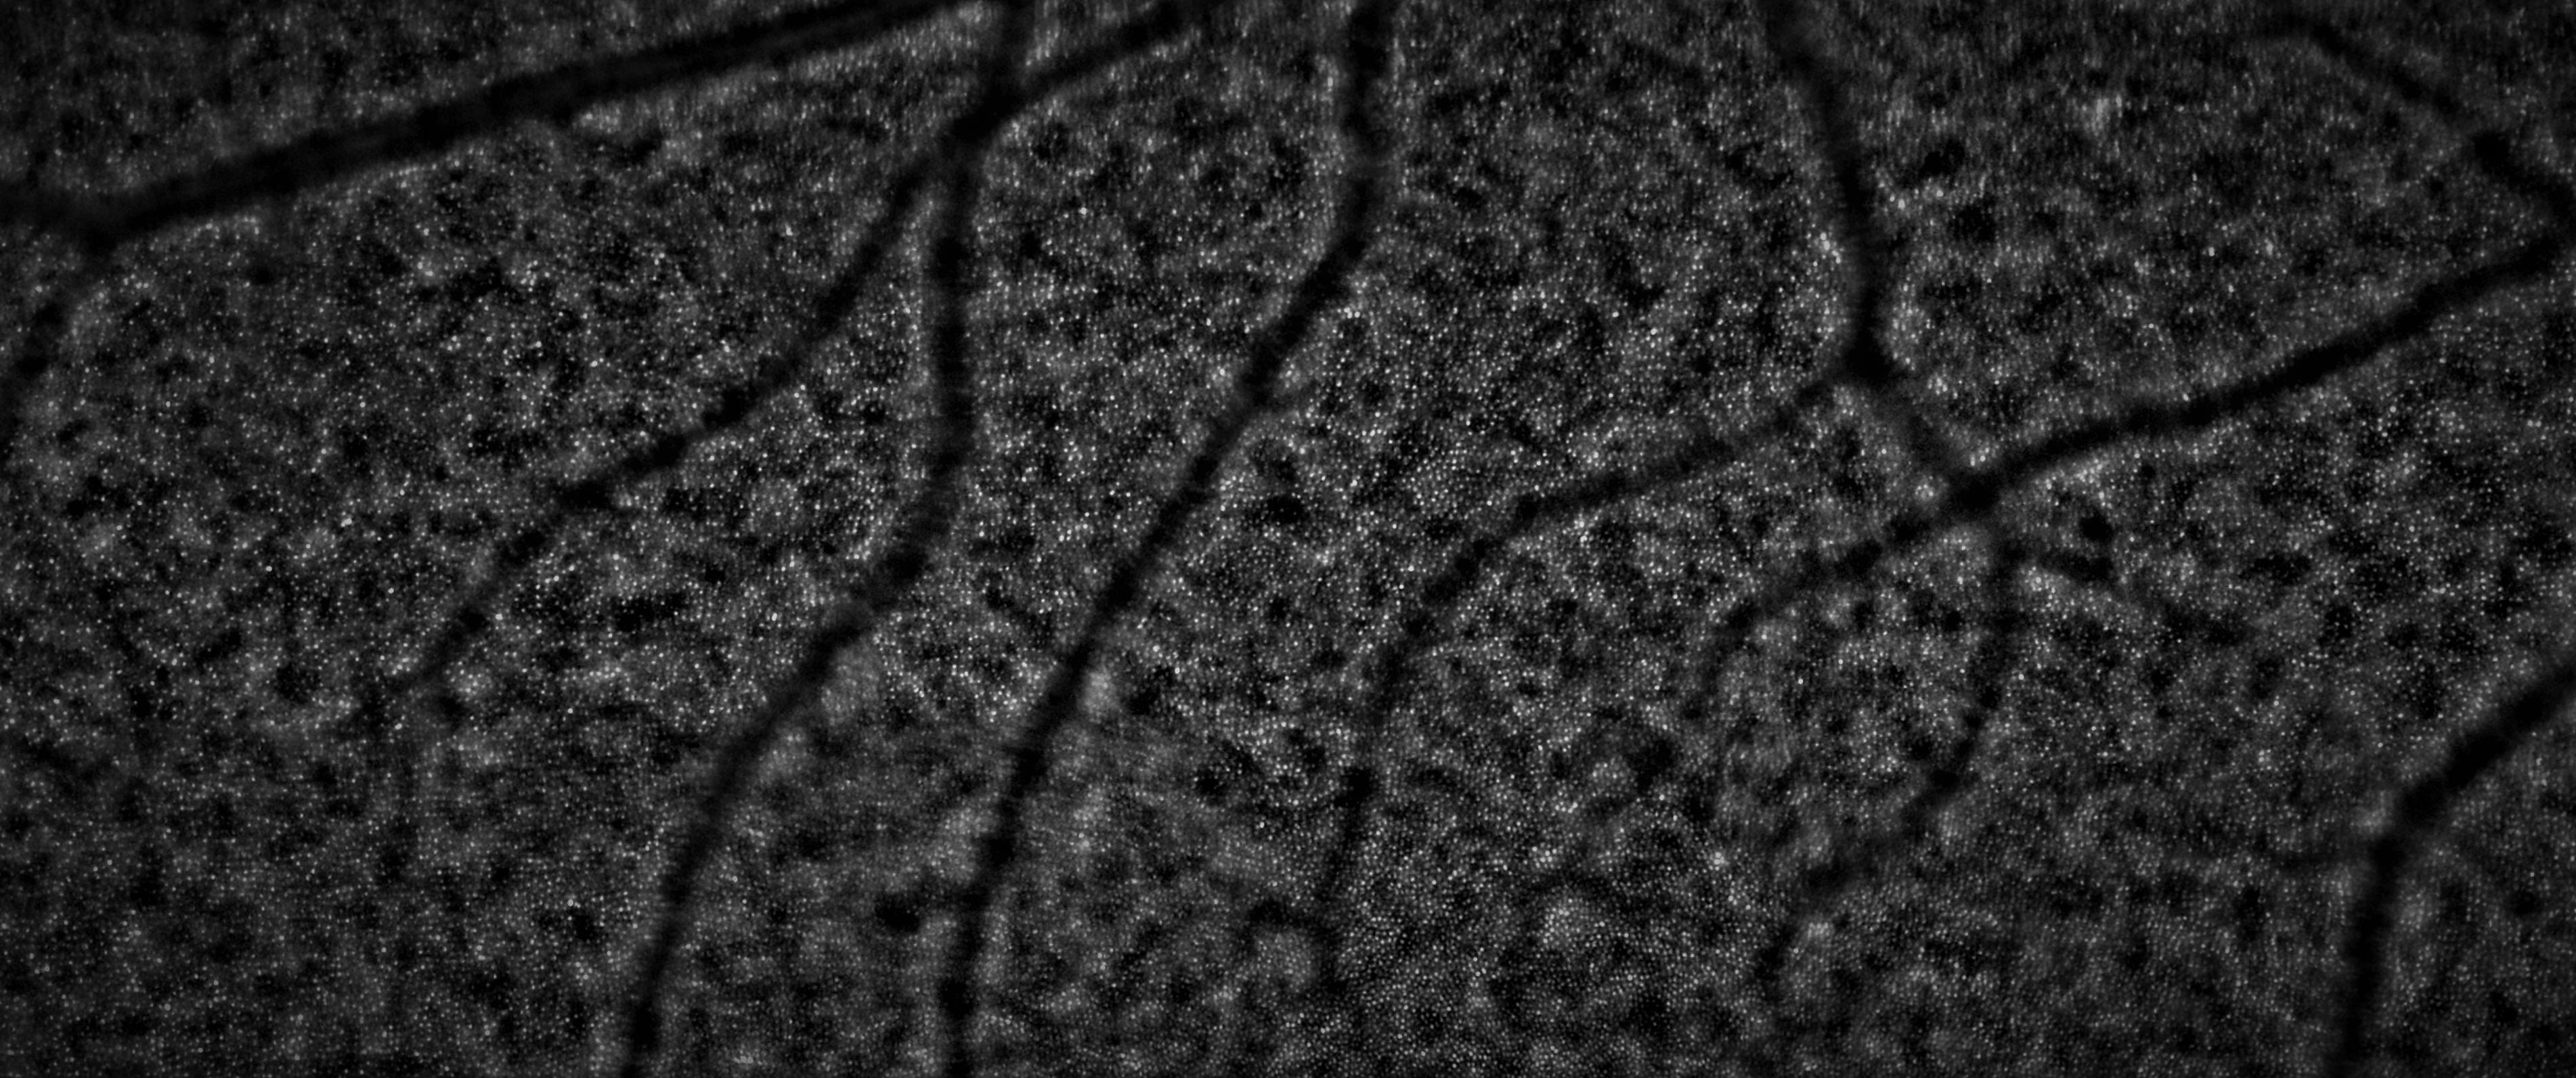
Adaptive optics is an imaging modality designed by NASA to track russian satellites during the Cold War. It is an optical system that detects and corrects for aberrations in the wavefront using a deformable mirror situated atop a matrix of actuators. The system can correct for motion artifact. In the case of imaging satellites, the target is large and the path length is quite long, however, this problem has been recast to imaging photoreceptors in the back of the eye in the retina. The eye is in constant motion, these rapid movements make imaging at the cellular level especially difficult despite having a very short path length. See below for a figure from Gill Et Al. 2019 Cellular imaging of inherited retinal diseases using adaptive optics describing the optical system.

Overview
- There are many formal analyses a researcher may do with these images, however, they are all contingent on the ability to identify the position of each individual cone
- As one can imagine, it is unfeasible to hand identify each of the ~7,000,000 cones in the retina
- While great progress has been made in using automated cone detection methods, these methods rely on manual validation, and are not perfect
- Therefore, here we propose a novel metric that helps to validate cones identified by automated cone detection algorithms are stable across imaging sessions
Steps
1) Image the same position on the retina 3+ times
2) Register each image
3) Identify cones that appear within some thereshold distance \(t) within each separate imaging acquisition
Cone Location Similarity Algorithm: Formal
\(C_i\) is a matrix containing the pixel coordinates for each of the n cones from image \(i\).
\[C_{i}=\left[\begin{array}{c}{\left(x_{1}, y_{1}\right)} \\ {\cdots} \\ {\left(x_{n}, y_{n}\right)}\end{array}\right]\]We can represent pixel coordinates \((x_1, y_1)\) for the first cone in set \(C_i\) as \(c_1\) and declare the Euclidean distance between coordinates \(c_1\) and \(c_2\) as…
\[||c_{1}, c_{2}||^{2}\]And,
\[\left(x_{1}-x_{2}\right)^{2}+\left(y_{1}-y_{2}\right)^{2}=\left\|c_{1}, c_{2}\right\|^{2}\]We then create a vector of distances between cone \(c_i\) of set \(C_i\) and all of the cones \((x)\) for each of our images \(N\)
\[X_{i}=\left\|c_{i}, x\right\|^{2}: x \in C_{N}\]\(c_i\) is said to be a shared cone if there exists a cone within the declared distance threshold \(t\), 5 pixels, of all other sets of images
\[f(x)=\left\{\begin{array}{ll}{1,} & {\text { if } \min \left(X_{i}\right) \leq t: \text { for all } \mathrm{N} \text { sessions }} \\ {0,} & {\text { else }}\end{array}\right.\]In the case that multiple cones exist within our threshold of \(c_i\), the cone is chosen that will minimize the mean distance between cones from all images \(N\)
\[arg \min \frac{1}{N} \sum_{i=1}^{N} \sum_{j=1}^{N-1}\left\|c_{i}, c_{j}\right\|^{2}\]Finally, cone location similarity is reported as the percentage of the number of detected shared cones, \(C_s\), and the mean number of cones, detected across \(N\) imaging sessions, where \(n_s\) is the number of cones detected
\[C L S=\frac{C_{s}}{\frac{1}{N} \sum_{i=1}^{N} n_{c}} \times 100\]Three acquisitions: Good Quality
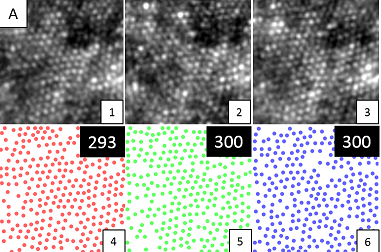
Here we see the counts are relatively stable across each of the three sessions.
Three acquisitions: Poor Quality
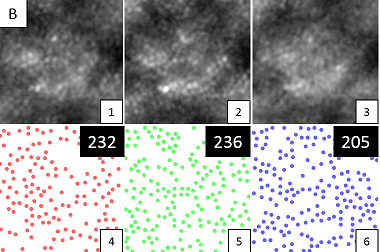
Here we see the counts are slightly less stable across each of the three sessions. However, one might notice the actual pixel coordinates for the identified cones looks highly variable for each acquisition
lets run the CLS algorithm to identify cones within each acquisition within the threshold distance of 5 pixels
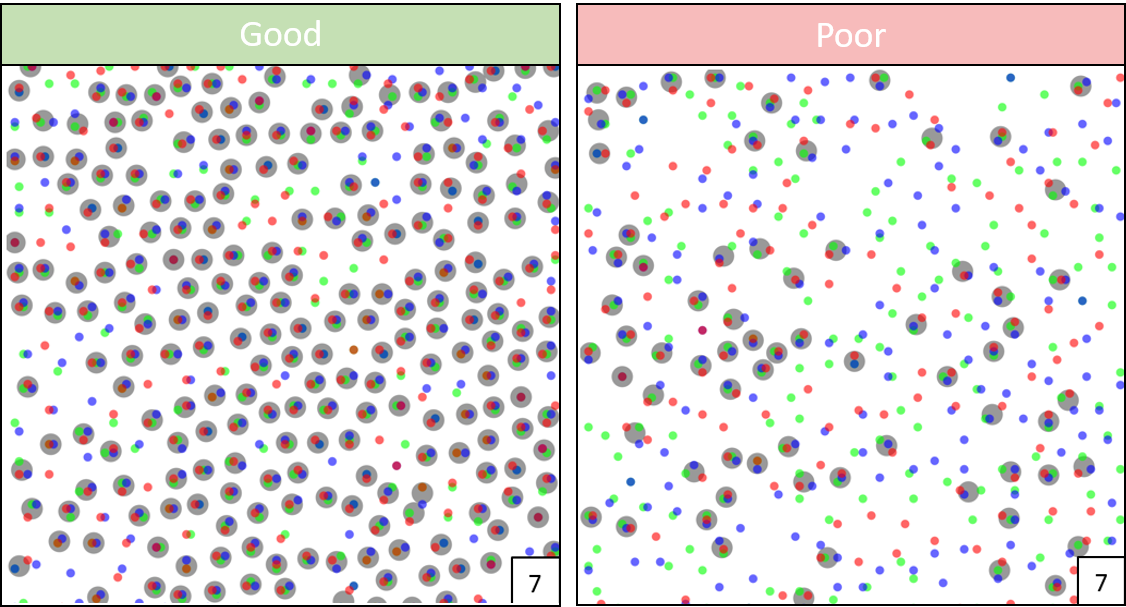
We see exactly as hypothesized above. While the counts to not reflect great variability in the series of lower quality images, the actual positions of these identified cones is greatly unstable. This instability is something not captured by either the actual number of photoreceptors or even the variability in counts over each acquisition. Only does this new CLS algorithm reveal the positional variability in these cones identified by automated detection methods.